Introduction
Career guidance is a comprehensive, developmental program designed to assist individuals in making and implementing informed educational and occupational choices. It develops an individual’s competencies in self-knowledge, educational and occupational exploration, and career planning.
The Department of Youth Resources and Sports in partnership with YouthNet supported by the Department of School Education Government of Nagaland initiated a program called “LaunchPad” which is career guidance and employability skill development program explicitly designed for students pursuing their 12 th standard in all Government Higher Secondary Schools across Nagaland.
The program consist of distinct modules which are specially created to help students utilize their time effectively during the lockdown situation and beyond in developing their soft skills, motivate them to pursue higher education, encourage them to explore avenues beyond traditional jobs and plan their career based on their abilities and interests. The program has three main objectives;
- Guide students to discover their ideal career path.
- Enable students to look beyond traditional jobs.
- Assist the student’s transition from school to work.
An online survey was conducted to assess the opinions, thoughts and aspirations of the students from 44 Government Higher Secondary Schools across 16 districts in Nagaland. A total number of 3622 students were registered for the LaunchPad program out of which 2475 students responded the survey up till date. The questions asked in the survey are varied and it covers a diverse range of topics. The survey is comprehensive in its scope as it covers different aspects of education system basing on the interest and perception of each student. The primary objective of this survey is to uncover answers, evoke discussion, base decisions on objective information and compare results. This valuable feedback is our baseline to measure and establish a benchmark from which to compare results over time.
Analytics/Data Analysis and Interpretation.
The data analysis for the survey is based on the reviews made on the survey’s questions and answers of the respondents. Data was processed, analyzed and interpreted through pie charts.
This section contains empirical data collected from the survey conducted and is analyzed and interpreted below. The facts and figures obtained through different ways are arranged significantly to stump the desired result. Every number and explanation obtained is the outcome of the data collected from the survey by the surveyors with the targeted respondents.
1. Stream.
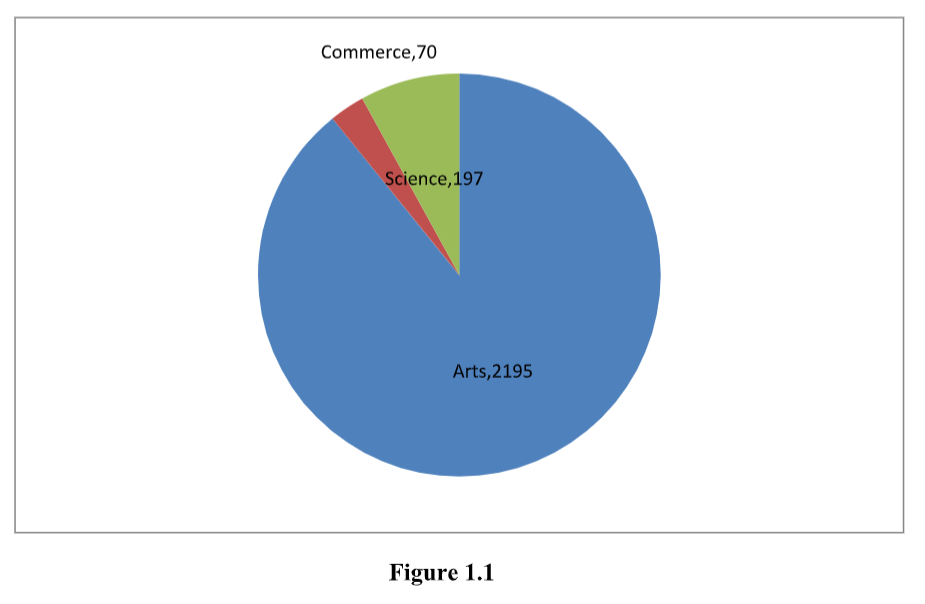 Fig. 1.1 depicts the stream or the educational identification each of the students wishes to pursue. Here, the streams are categorized into three sections i.e. Arts, Science and Commerce. Among 3622 respondents, a number of 2195 students are identified under Arts stream, 197 students under science stream and 70 students under Commerce stream. Henceforth, the data projects that majority students are commencing Arts basing on their will and interest.
2. Gender of the Respondents/Students.
Gender is the range of characteristics pertaining to, and differentiating between, masculinity and femininity.
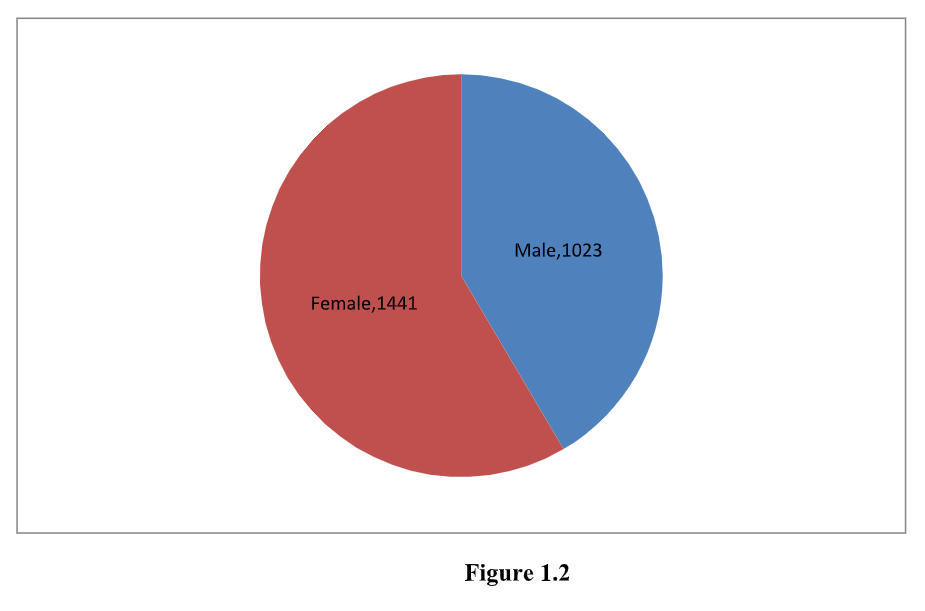 Fig 1.2 categorizes the gender group of each respondent. From the data collected it is proven and witnessed that the female respondents are majority in number i.e., 1441 comparing to the male respondents comprising 1023 in number.
3. Which of the following are you planning on doing after you have received your High School/Higher Secondary Certificate?
 The above figure depicts the educational areas the students are interested to pursue after their class 12. From the collected data it is evident that majority of the students comprising 1957 in number are in favor of pursuing Higher Education, 261 students desiring to get a job, 147
students under the category of pursuing apprenticeship or internship, 45 students under the category of pursuing or performing other jobs, while 38 students are in favor of taking a gap year before entering college or university and 5 students are categorized under pursuing vocational training.
4. Who/What has had the most influence on your decision to go to college/university, into a job or training?
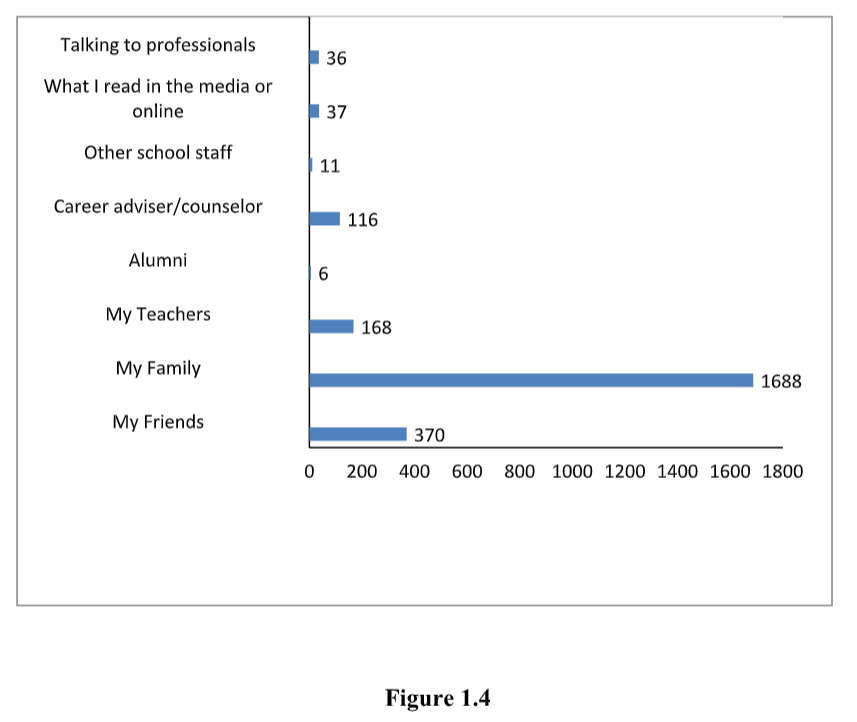 The above figure no. 1.4 explains the influential characters played by different actors/people in the decision-making process of the students. Majority of the students i.e. 1688 in number are of the view that Family plays the most influential role while deciding to go forward to taking up any course. 370 students are of the opinion that Friends plays a dominant role in influencing one another while choosing one’s path, 167 students are of the view that Teachers plays a prominent role, 116 students opted for Career guidance/ Counselors, 36 students of the opted for media and newspapers as their main influential factor, 36 students are of the view that their influential factor is talking with professionals while 11 students agree upon the factor that other school staffs are their influential characters and 6 students opted for the Alumni category with the least in number.
5. Have you taken any test or online assessment to understand yourself better or to suggest well-matched careers?
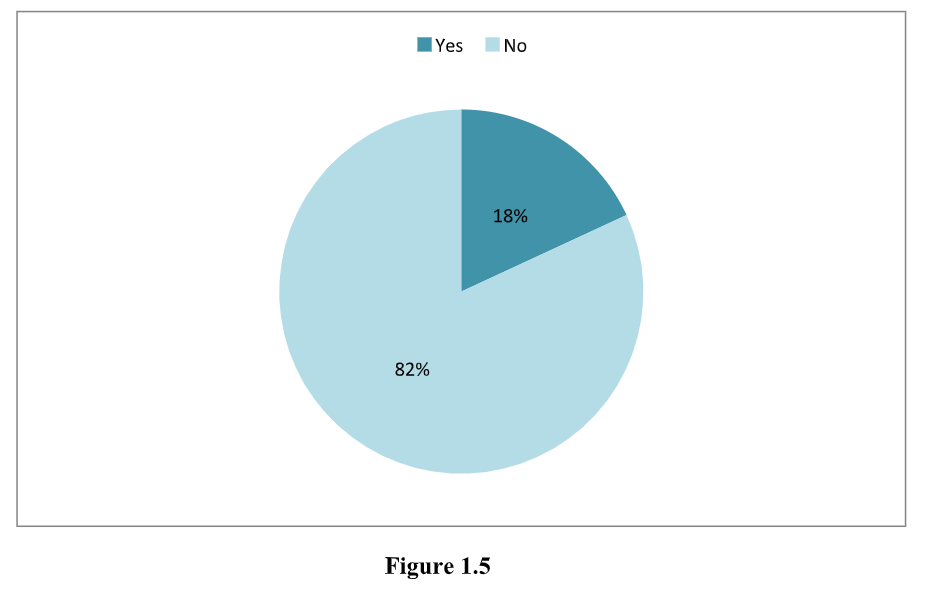 The above figure projects the number of tests or additional career evaluations the students/respondents had done in the course of their studies. From the analyzed data it is evident that 82% of the students had not taken or given any assessment tests or exams while 18% of the students had given online tests regarding the stated question. Therefore, it is clearly seem from the rated percentage that majority of the students have not yet appeared neither exams nor tests online.
6. Which subjects are you most likely to study at college?
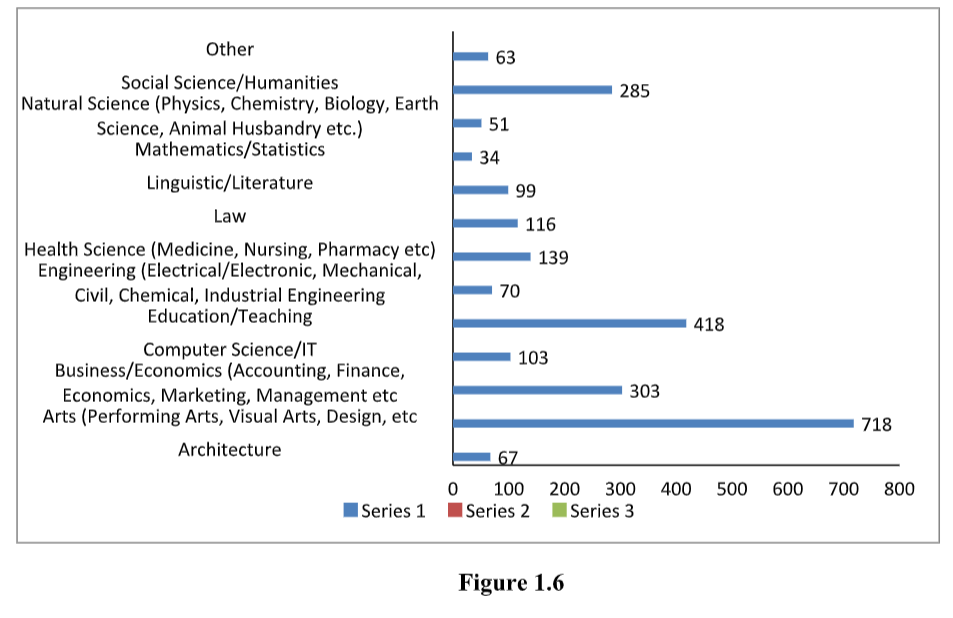 The above figure described the career each of the students are likely to take up after their class 12. Majority of the students with 718 in number opted to study Arts at college while a number of 34 students are indentified to pursue their college with Mathematics/Statistics which comprises the least number of students.
7. What is your main reason for wanting to study these subjects at college/university?
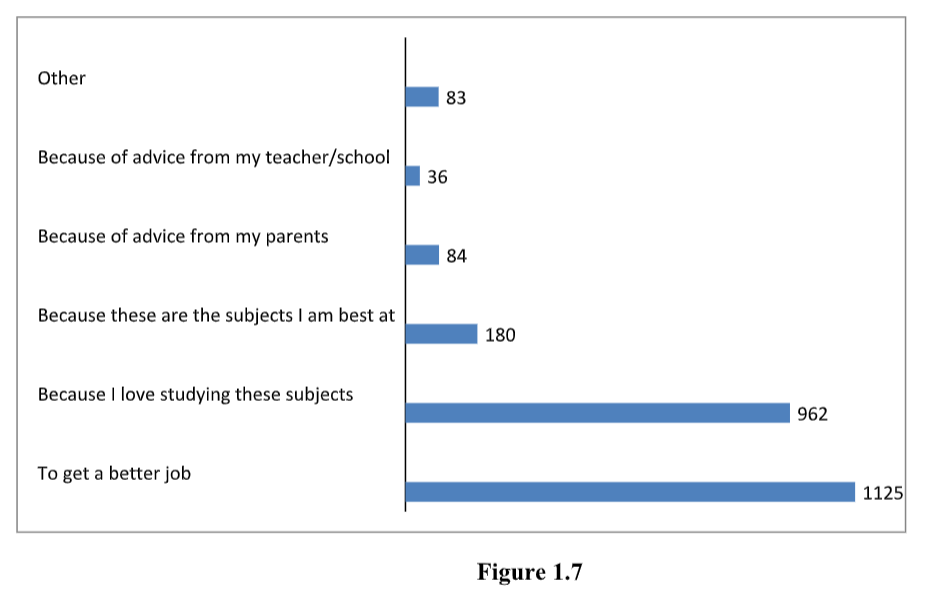 Figure 1.7 displays each student sole decision on pursuing their higher education. A number of 1125 student’s main purpose pursing college is towards getting a better job, 962 students deciding to go to college because they love studying the opted subjects, 180 students pursuing
college because those selected subjects are the subjects they are best at, also 84 students pursuing college with advises from their parents, while 83 students opted for the other category and 36 students are in the view of going to college because of the advises they received from their teachers at school.
8. How much advice and information about higher education, apprenticeship, internship and career guidance have you received at school?
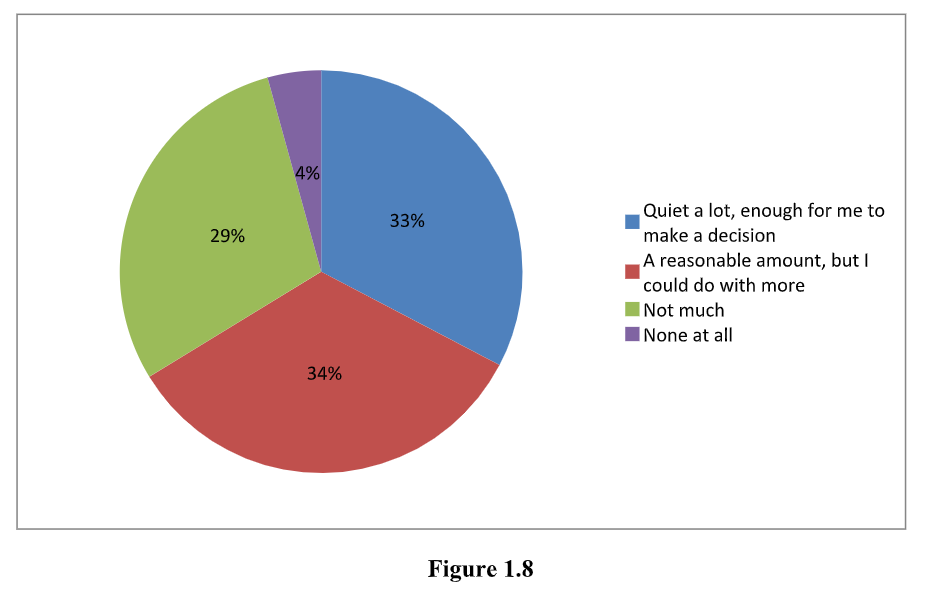 Fig 1.8 depicts the number of advices and consultations the students received at school about career guidance, apprenticeship and internship. It is therefore, identified that majority of the students opted for the option 2 with 34% i.e., A reasonable amount, but I could do with more. 33% opted for the option no 1. I.e. quiet a lot, enough for me to make a decision, 29% opted for the not much category and 4% under the None at all category.
9. Which of the following medium or site do/did you use to research about courses/careers/employment?
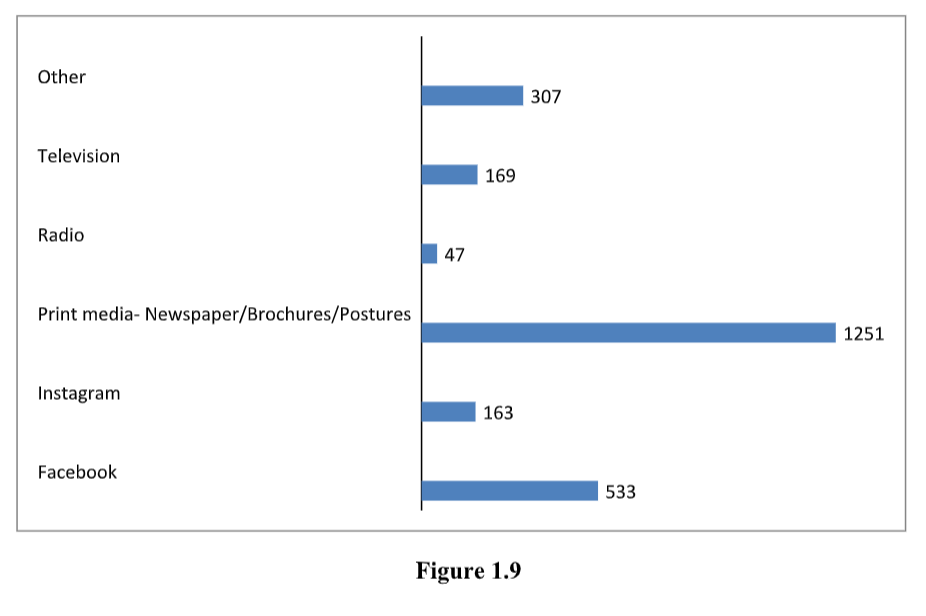 The above figure projects the different medium student’s uses in order to access information and gain insightful knowledge. Students with the highest number comprising 1251 in number opted for Print media- newspaper/ brochures/ postures and students with the least in number comprising 47 in number opted for the Radio option.
10. Why do you want to pursue higher education outside Nagaland?
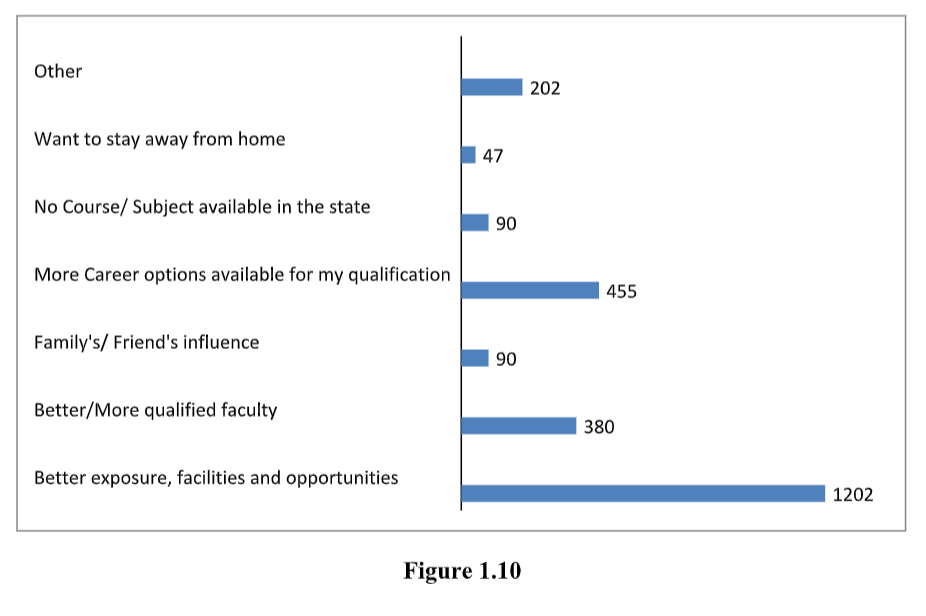 Figure 1.10 projects the decision and perception of the students working or pursuing their studies outside Nagaland. The collected data depicts that the main reason students wanting to study outside Nagaland is to get better exposure via experience better opportunities and get access to better facilities.
11. Which two of these skills do you think are most important for success in a job?
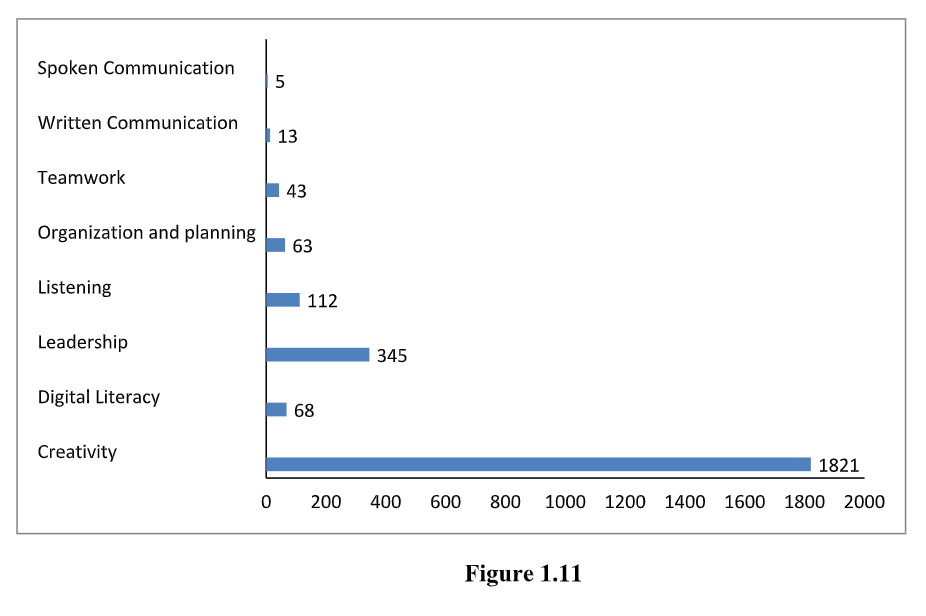 Figure 1.11 describes the comparative skills the students are provided best fitted for success in a working environment. Amongst the many options such as spoken communication, written communication, teamwork, organization and planning, listening, digital literacy, majority of the students opted for Creativity Skills comprising 1821 students and Leadership Skills comprising 345 students.
12. Where do you think you mainly learn the skills that you are best at?
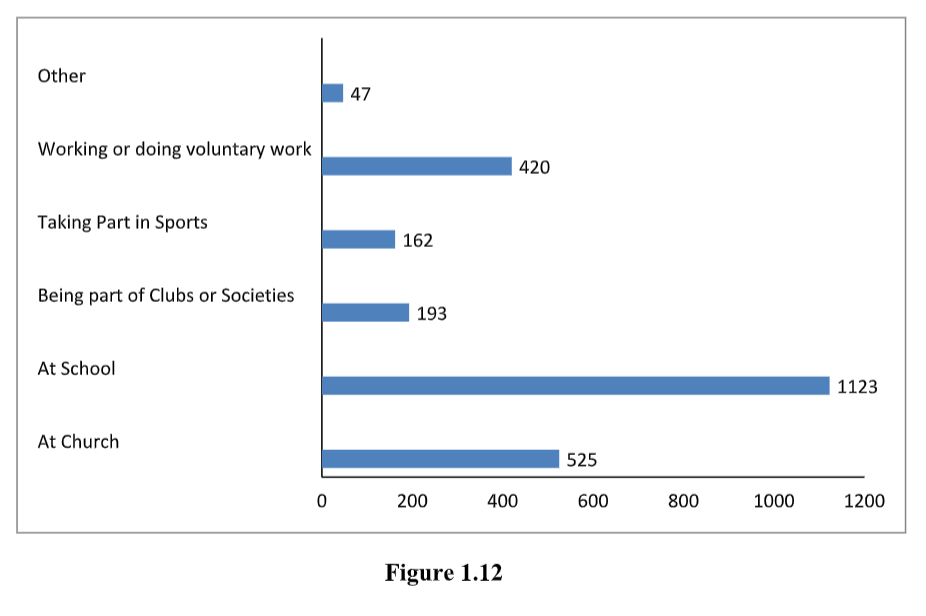 Figure1.12 provides a distinct platform for students to personally develop their organizational skills where the data projects that majority of the students prominently stated that the learnt skills are developed at School with 1123 participants.
13. Which of the following would you most like to work for?
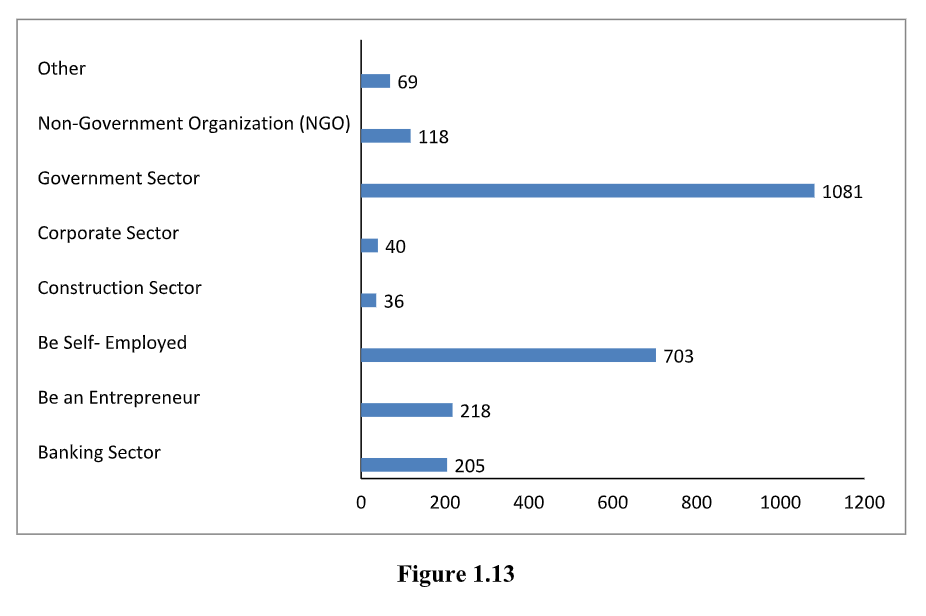 Figure 1.13 depicts the various platform students desire to work at. Thus, the figure identifies majority of the students to work at Government Sector comprising 1081 in number, 703 students opting to be self-employed, 218 students to become Entrepreneur, 205 students opted to working at Banking Sector, 118 students opted to work at NGOs, 69 students to work in other sectors, 40 students opted towards working at Corporate sector and 36 students towards working at Construction Sector rating the least in number.
Major Findings.
This section contains the major findings from the analyzed data of the previous findings.
- It is identified that majority of the students wishes to pursue higher education after their higher secondary instead of going for other options.
- It is found that majority of the students are not very well equipped or accessible towards digital literacy from the collected data.
- It is found that students are not very well- versed with vocational training courses thus majority of the students had no option rather pursue higher education. Therefore, the lack of information is a serious concern being identified by the surveyors.
- It has been indentified that there is a serious concern and need for digitalization, better infrastructure, better facilities to be reintegrated and developed in Nagaland as students are of the opinion that better facilities and employable opportunities lies ahead outside the state therefore, resulting in immigration of students in other states or outside elsewhere.
- It is found that more students are on the view towards working in Government sector rather than in any workforce sector.
Solutions.
- Eradicate the mentality of self-dependency from student’s mindset.
- Do away with corruption socially, politically, economically.
- Develop policy of Non-judgmental attitude.
- Educate parents (seminar, conferences, etc.)
- Proper guidance and career counseling.
- Assess and conduct more surveys regarding the education system and identify interventions basing on the findings.